A) an upward shift of the saving function.
B) a downward shift of the saving function.
C) a downward shift of the corresponding consumption function.
D) a movement to the right along the saving function.
E) a movement to the left along the saving function.
G) C) and E)
Correct Answer

verified
Correct Answer
verified
True/False
MPI refers to the percentage of additional domestic income spent on imports.
B) False
Correct Answer

verified
Correct Answer
verified
True/False
The average propensity to save (APS)is the proportion of disposable income that is saved.
B) False
Correct Answer

verified
True
Correct Answer
verified
Multiple Choice
Which of the following will cause the investment function to shift upward?
A) An decrease in government subsidies to businesses
B) An increase in business profits
C) A decline in capacity utilization
D) Expectations of higher business taxes
E) An increase in the market rate of interest
G) B) and D)
Correct Answer

verified
Correct Answer
verified
True/False
Suppose that the consumption function crosses the 45-degree line at a disposable income level of $800.Assume further that saving equals $200 when disposable income is $1, 300.This implies that the MPC must equal 0.6.
B) False
Correct Answer

verified
Correct Answer
verified
Multiple Choice
The table given below reports the consumption expenditure of a nation at different levels of disposable income. Table 9.1
 Refer to Table 9.1.At an income level of $10, 000, the APS equals -0.20.Therefore, the APC has to equal:
A) 0.20.
B) 0.80.
C) -1.20.
D) 1.20.
E) 1.80.
G) All of the above
Correct Answer

verified
Correct Answer
verified
True/False
Changes in autonomous consumption will affect the slope of the consumption function.
B) False
Correct Answer

verified
Correct Answer
verified
True/False
Dissaving occurs when the consumption function lies belowthe 45-degree line.
B) False
Correct Answer

verified
False
Correct Answer
verified
Multiple Choice
If it is assumed that there are absolutely no taxes in an economy, then aggregate consumption will be drawn as a function of:
A) disposable income.
B) real GDP.
C) government expenditure.
D) private income.
E) government transfers.
G) B) and E)
Correct Answer

verified
Correct Answer
verified
Multiple Choice
In the table given below Y represent the aggregate expenditure of the economy on C = consumption, I = investment, G = government projects, and X = net exports. Table 9.3
 Refer to Table 9.3.Compute the marginal propensity to save in the economy.
A) 0.10
B) 0.20
C) 0.25
D) 0.50
E) 0.75
G) A) and C)
Correct Answer

verified
Correct Answer
verified
True/False
Other things equal, a marginal propensity to import of 0.8 implies that a $100 million increase in domestic income will lead to an $80 million decrease in net exports.
B) False
Correct Answer

verified
Correct Answer
verified
Multiple Choice
The income net of taxes is called _____.
A) real income
B) disposable income
C) nominal income
D) taxable income.
E) personal income.
G) A) and C)
Correct Answer

verified
Correct Answer
verified
Multiple Choice
As disposable income rises:
A) consumption falls as a percentage of disposable income.
B) the average propensity to consume increases.
C) saving falls as a percentage of disposable income.
D) the average propensity to consume remains unchanged.
E) consumption rises as a percentage of disposable income.
G) A) and E)
Correct Answer

verified
Correct Answer
verified
Multiple Choice
The table given below reports the consumption expenditure of a nation at different levels of disposable income. Table 9.1
 Refer to Table 9.1.When disposable income is $20, 000, consumption spending equals:
A) $24, 500.
B) $15, 000.
C) $18, 500.
D) $19, 500.
E) $18, 000.
G) B) and C)
Correct Answer

verified
D
Correct Answer
verified
Multiple Choice
As household wealth increases, it will experience a(n) :
A) increase in its MPC.
B) decrease in autonomous consumption.
C) decrease in its MPS.
D) increase in autonomous consumption.
E) increase in autonomous saving.
G) A) and B)
Correct Answer

verified
Correct Answer
verified
Multiple Choice
What would be the impact of an increase in foreign income on the net export function?
A) The net export function would shift upward.
B) The net export function would shift downward.
C) The slope of the net export function would increase.
D) The slope of the net export function would decrease.
E) There would be a movement up along the net export function.
G) C) and D)
Correct Answer

verified
Correct Answer
verified
Multiple Choice
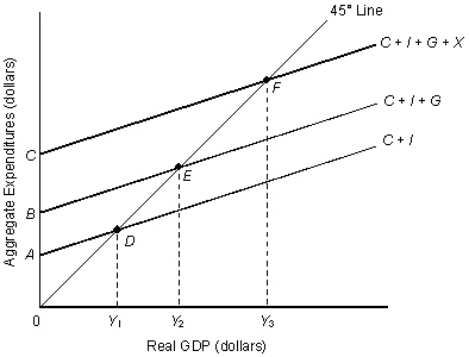
The figure given below shows the aggregate expenditures function of an economy. Figure 9.5  Refer to Figure 9.5.The amount of government spending is indicated by the distance _____.
A) Y1Y2
B) DE
C) Y2Y3
D) BC
E) AB
G) B) and C)
Correct Answer

verified
Correct Answer
verified
Multiple Choice
Which of the following is least likely to contribute to the volatility of investment spending?
A) Expectations about business conditions
B) Changes in government spending
C) Changes in tax laws
D) Changes in capacity utilization
E) Interest rate fluctuations
G) A) and B)
Correct Answer

verified
Correct Answer
verified
Multiple Choice
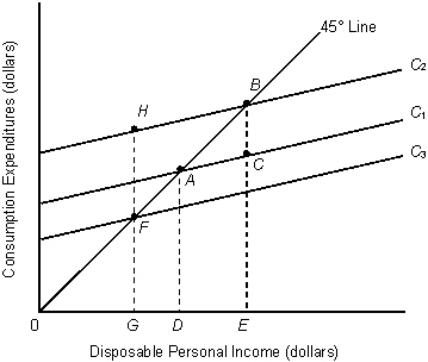
The figure given below shows the consumption functions of an economy. Figure 9.4  Refer to Figure 9.4.Which of the following could explain a downward shift of the consumption function from C1 to C3?
A) An increase in household wealth
B) A decrease in the proportion of young people in the population
C) An increase in the size of the population
D) A decrease in consumer confidence
E) An autonomous decrease in saving
G) C) and E)
Correct Answer

verified
Correct Answer
verified
Multiple Choice
Which of the following would cause a change in imports?
A) A change in foreign income
B) A change in foreign consumption
C) A change in domestic tastes for foreign products
D) A change in foreign tastes for domestic products
E) A change in domestic investment spending
G) A) and C)
Correct Answer

verified
Correct Answer
verified
Showing 1 - 20 of 115
Related Exams